Amcor (AMCR)·Q2 2026 Earnings Summary
Amcor Q2 FY2026: EPS Beats as Berry Synergies Accelerate, Stock Up 2.7%
February 3, 2026 · by Fintool AI Agent
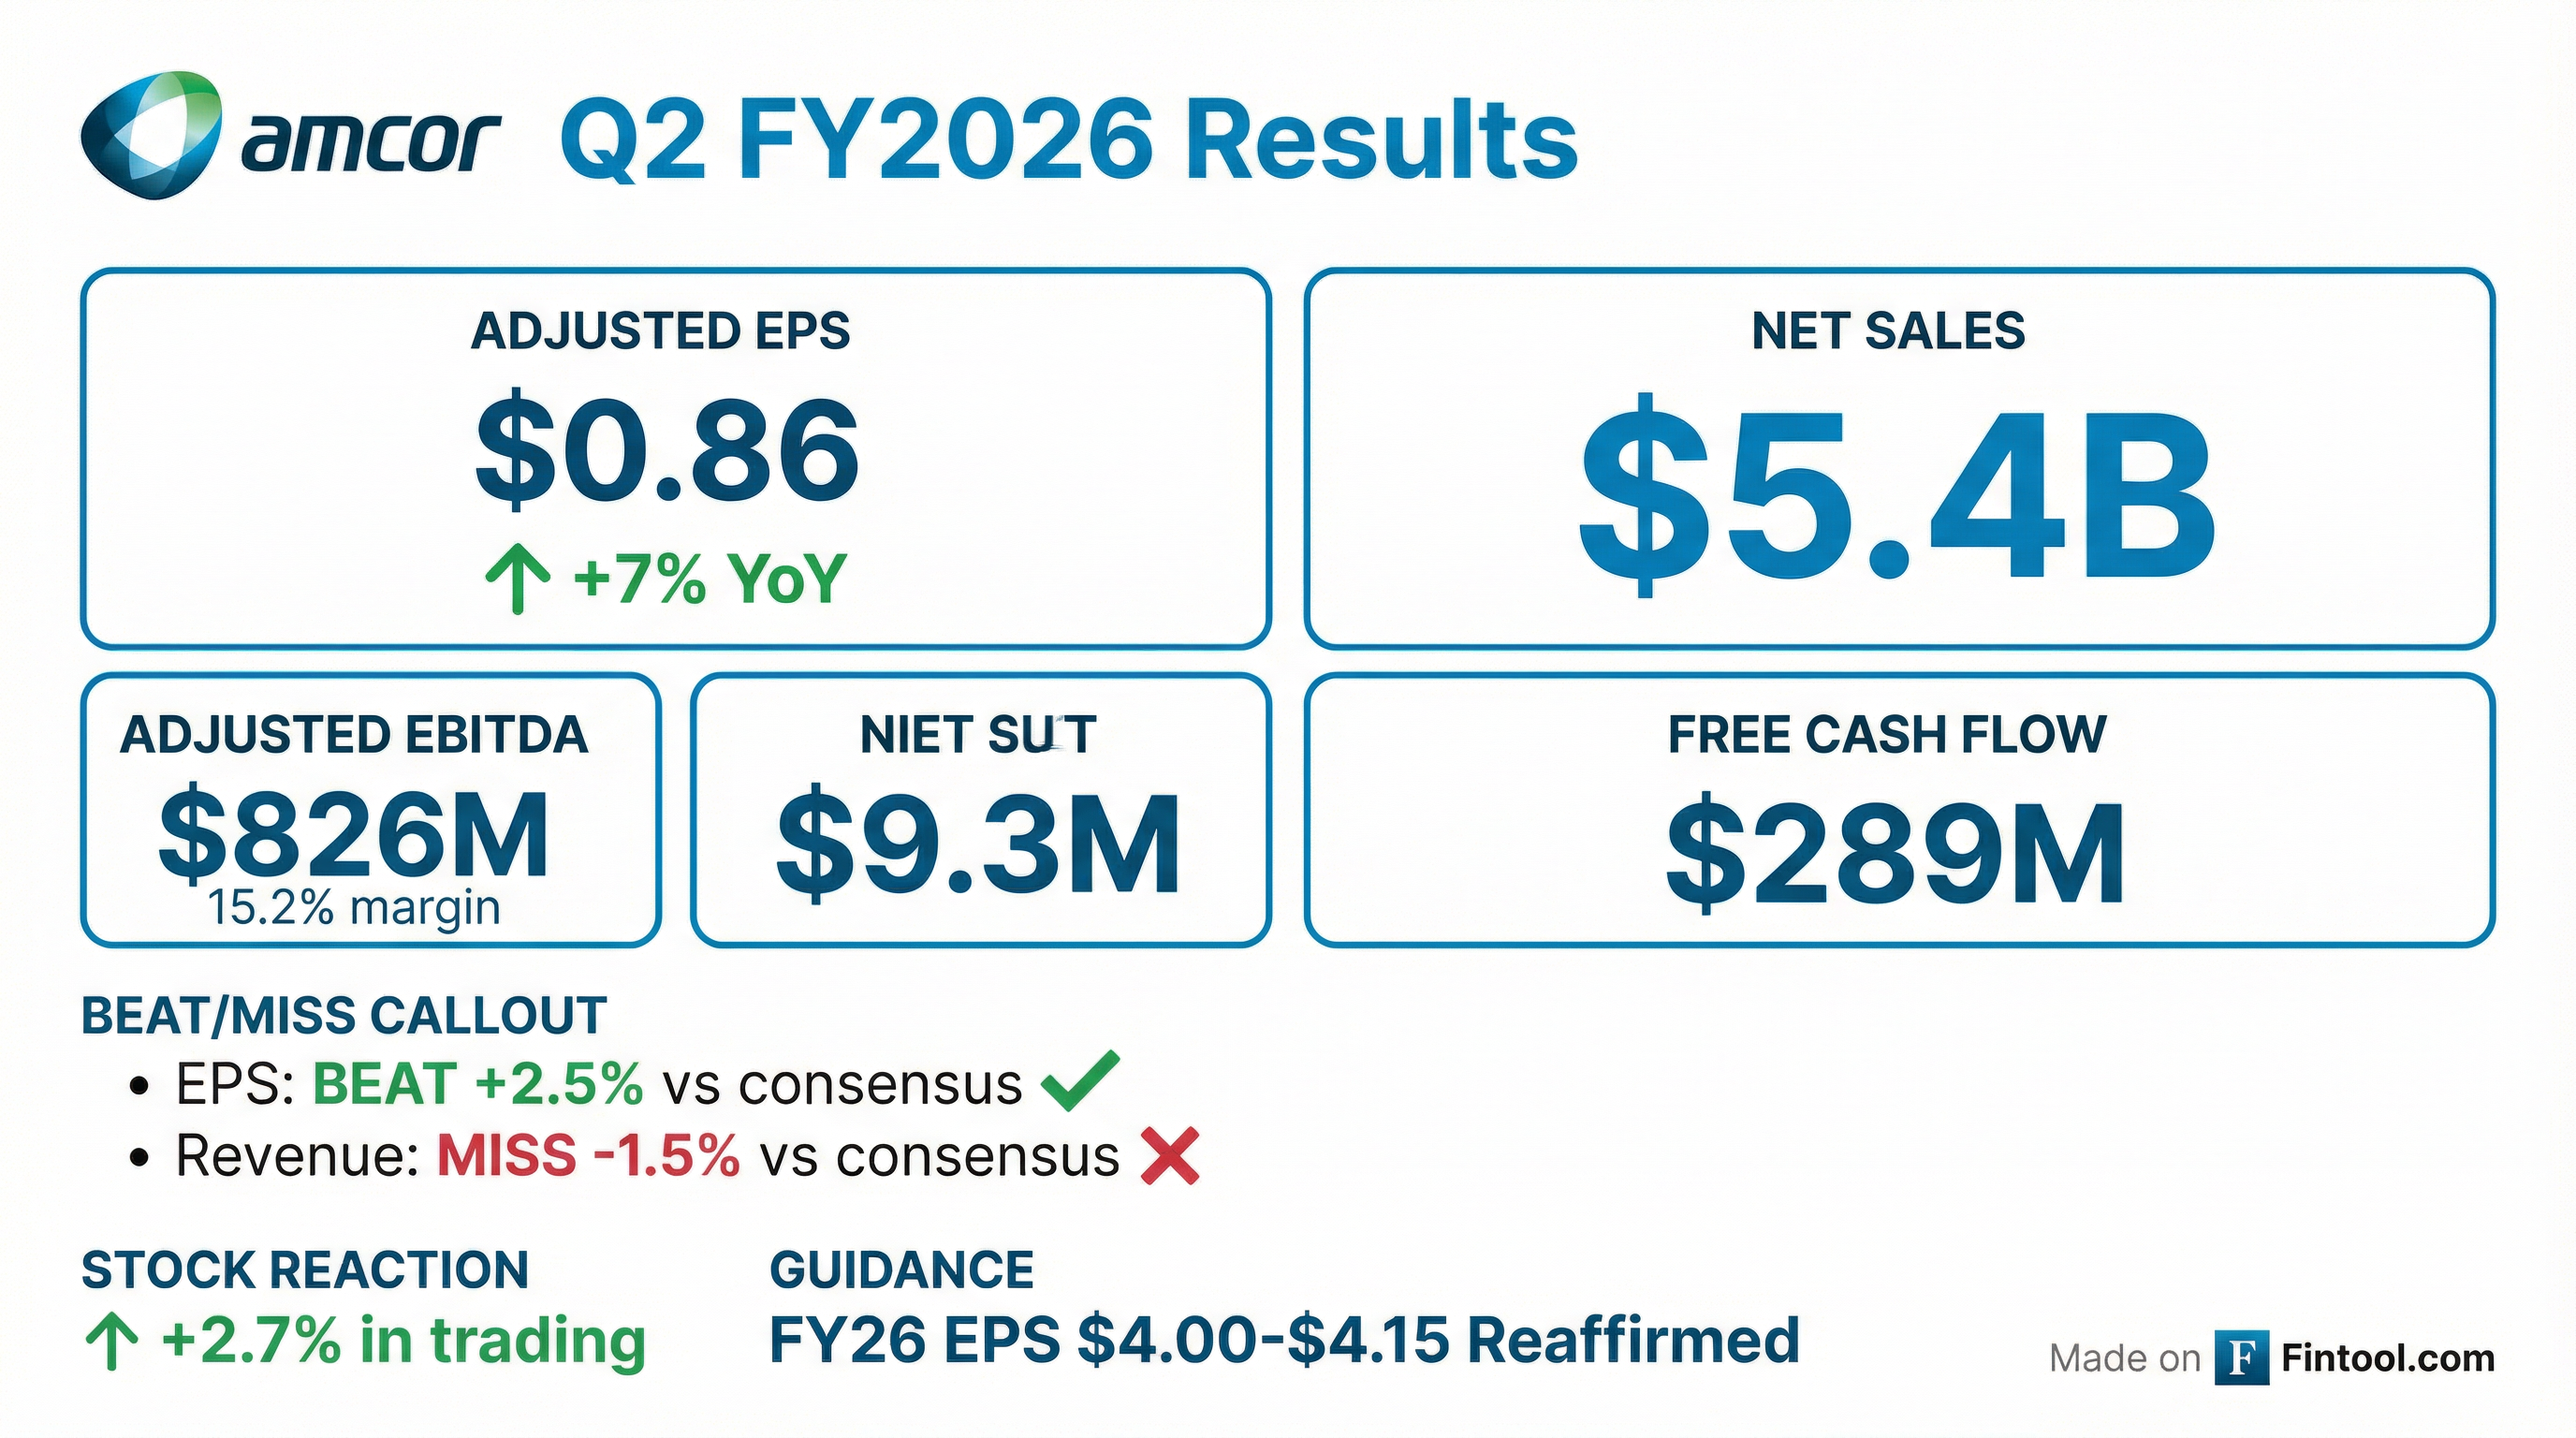
Amcor delivered Q2 FY2026 adjusted EPS of $0.86, beating consensus by 2.5% as Berry Global merger synergies reached $55 million in the quarter—at the upper end of expectations . Revenue of $5.4 billion missed estimates by 1.5% on soft volumes, but the stock rose 2.7% as management reaffirmed full-year guidance and highlighted accelerating integration progress .
Did Amcor Beat Earnings?
Amcor beat EPS expectations despite revenue coming in slightly below consensus. The beat was driven by better-than-expected synergy realization from the Berry Global acquisition and disciplined cost management . On a year-over-year basis, adjusted EPS grew 7% while H1 FY2026 EPS is up 14% .
Key performance highlights for Q2 FY2026 :
What Did Management Guide?
Full-Year FY2026 Guidance Reaffirmed :
Q3 FY2026 Guidance :
Supplemental Guidance :
- Adjusted D&A: ~$875-$925M
- Adjusted Net Interest Expense: ~$570-$600M
- Effective Tax Rate: ~17-20% (improved from prior 19-21%)
- Capital Expenditures: ~$850-$900M
*Values retrieved from S&P Global.
How Did the Stock React?
Amcor shares rose 2.7% to $44.92 following the earnings release, with aftermarket trading pushing the stock to $45.21. The positive reaction reflects:
- EPS beat despite revenue softness
- Synergies ahead of expectations ($55M vs upper end of range)
- Guidance reaffirmation removing execution uncertainty
- Dividend increase of 2% to $0.65/share
The stock is trading 6% above its 50-day moving average ($42.40) and 2.5% above the 200-day average ($43.83), indicating positive momentum following the Berry integration progress.
What Changed From Last Quarter?
Berry Integration Accelerating: Q2 synergies of $55 million were at the upper end of expectations, compared to $38 million in Q1 FY2026. H1 synergies total $93 million, putting the company on track for $260+ million in FY26 .
Synergy Sources :
- G&A: ~$160M (3-year target)
- Procurement: ~$325M (3-year target)
- Financial: ~$60M (3-year target)
- Operational: ~$45M (3-year target)
- Growth: ~$60M (3-year target)
Volume Weakness Persists: Comparable volumes declined ~2.5% in Q2, with the core portfolio down ~1.5% and non-core businesses down high single digits . Focus categories (pet care, proteins, health/beauty, liquids, food service) outperformed by 50-100 bps. Excluding synergies, core portfolio EBIT was broadly flat to prior year.
Portfolio Optimization Progress: Amcor has reached agreements to sell 2 non-core businesses for combined proceeds of ~$100 million, sharpening focus on the ~$20 billion core portfolio .
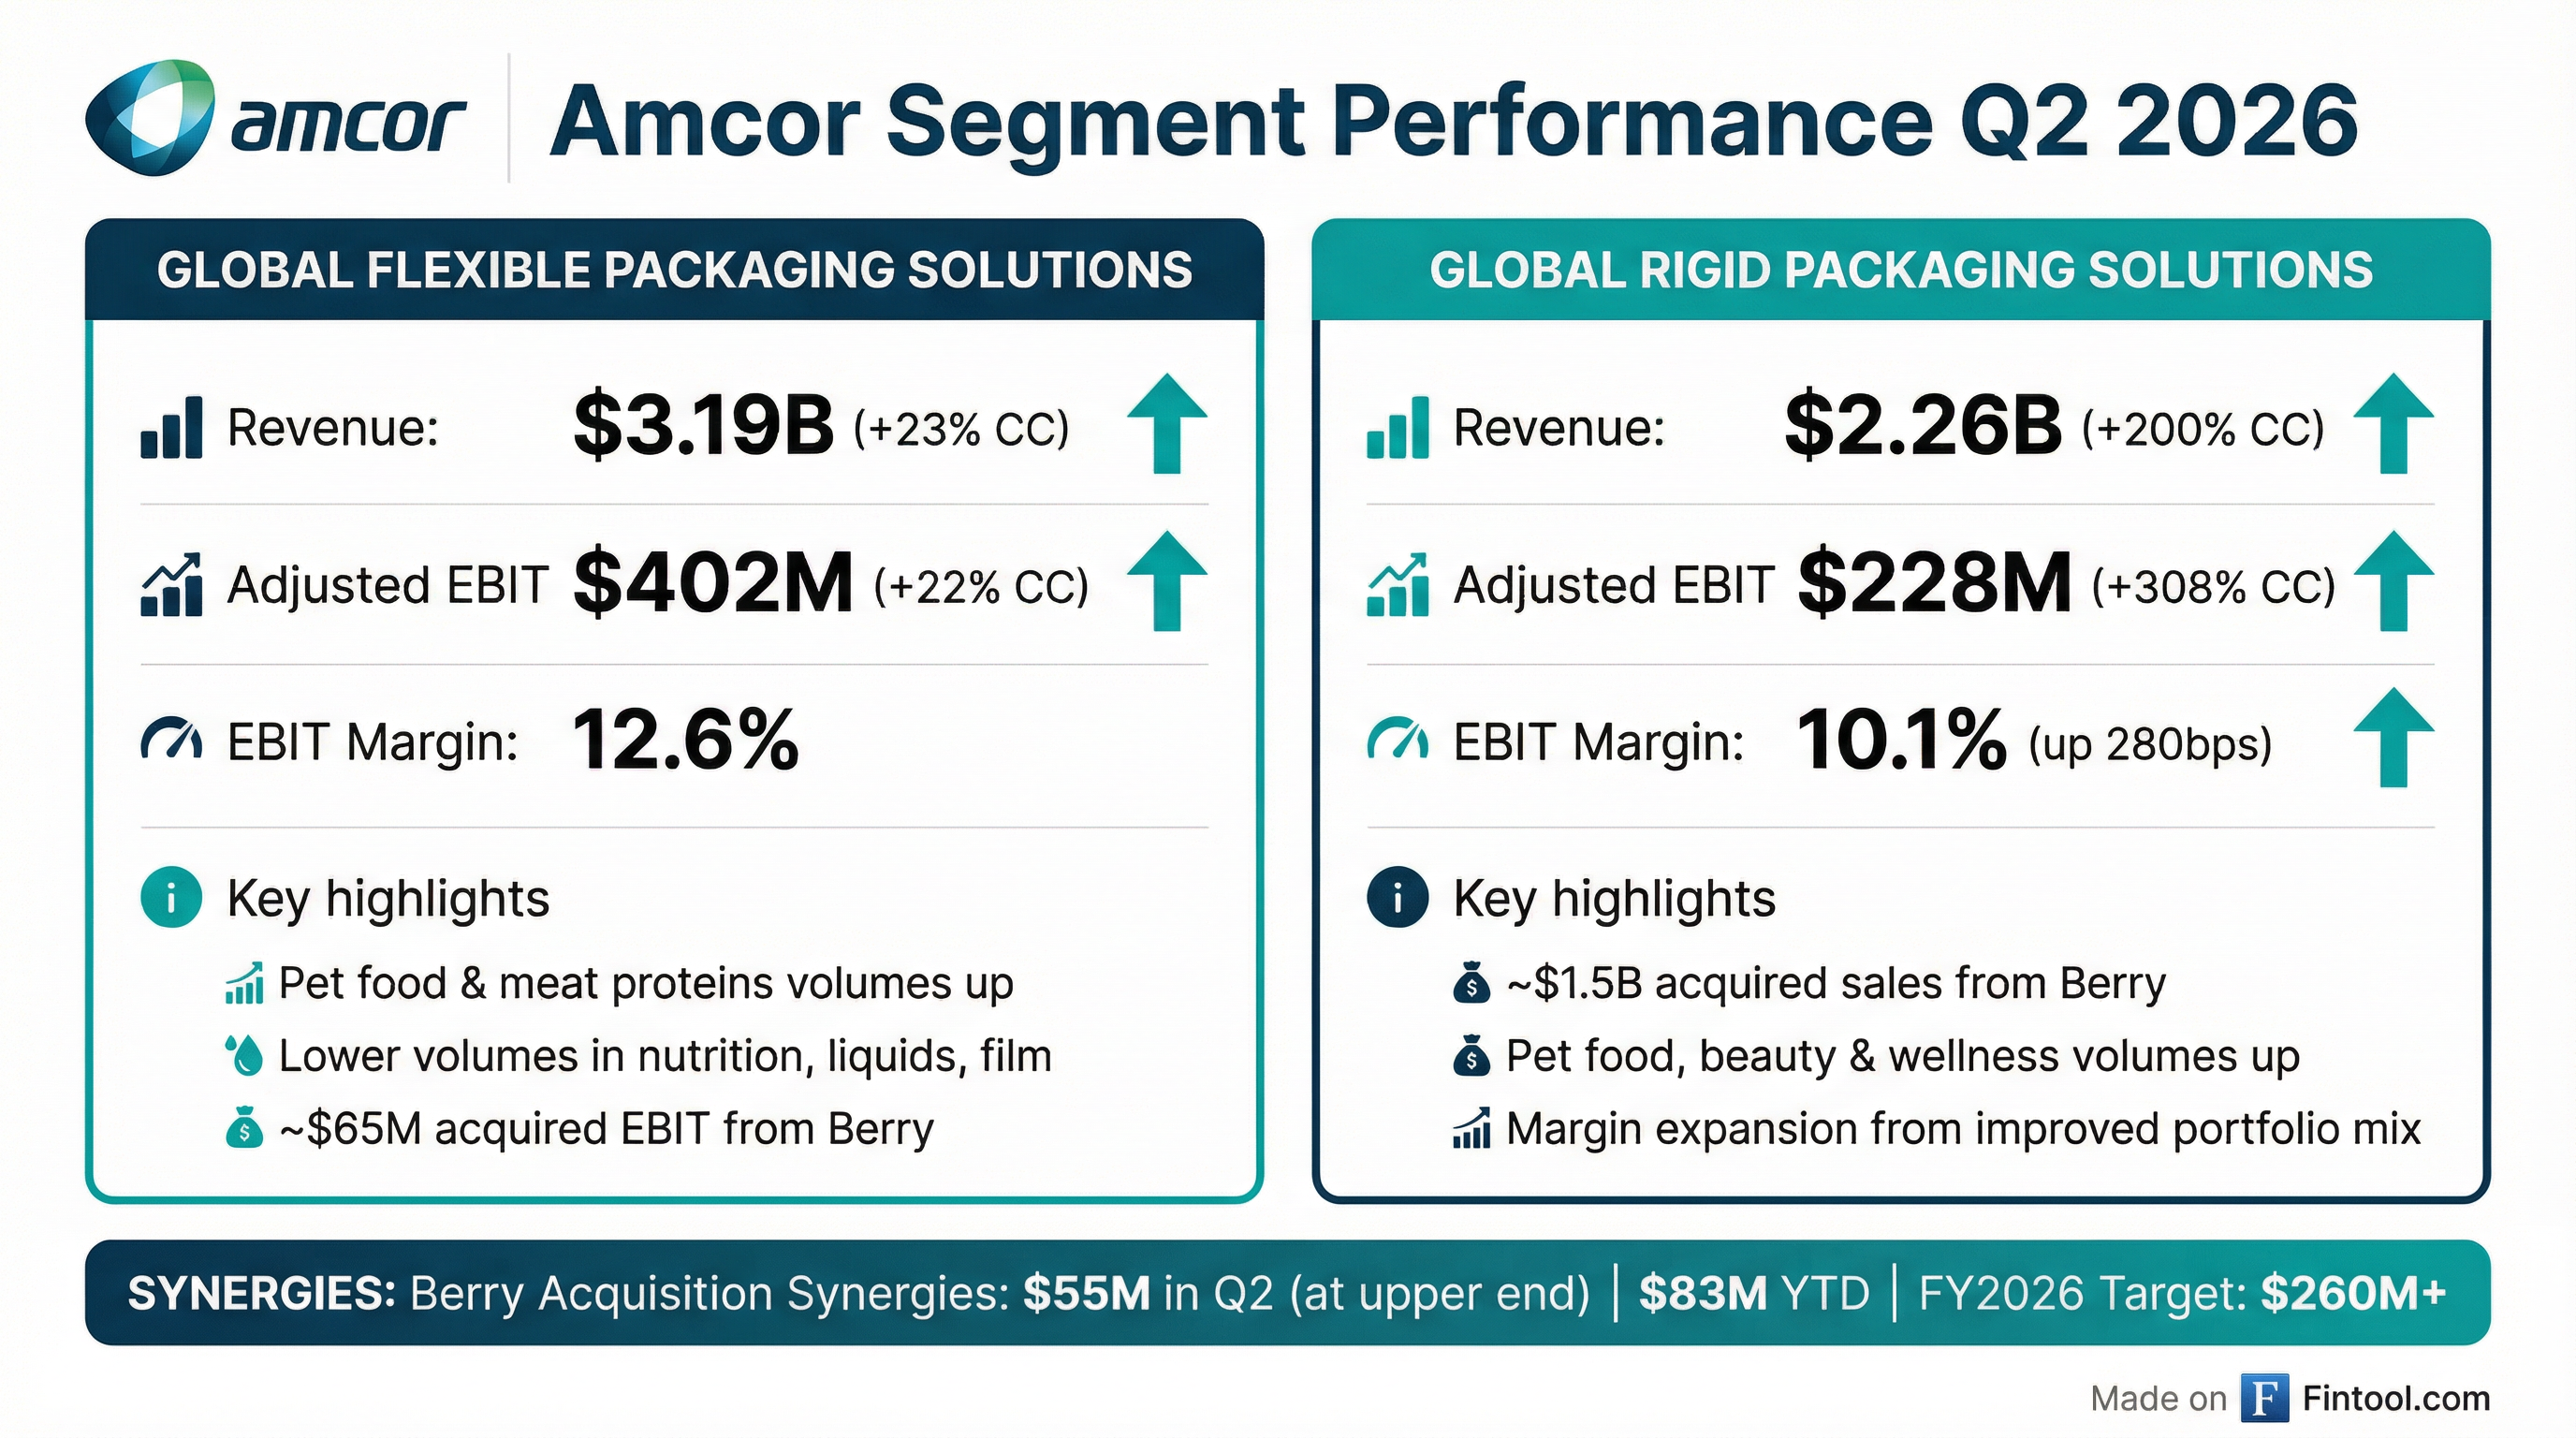
Segment Performance
Global Flexible Packaging Solutions
The large reported growth reflects the Berry Global Flexibles acquisition (24% of sales growth from acquisitions). On a comparable basis, volumes declined ~2% while adjusted EBIT was up ~1% driven by synergies, cost, and productivity benefits .
Global Rigid Packaging Solutions
The segment transformation reflects the Berry Consumer Packaging International and North America acquisitions. Excluding non-core businesses, volumes were flat—with North America flat and Latin America up low single digits—and adjusted EBIT grew ~15% with margins improving ~200bps to ~12% .
Balance Sheet and Cash Flow
The H1 free cash flow use of $(53) million is typical seasonal pattern for Amcor. Working capital investment of $611 million and integration costs of $184 million were primary drags . Management expects strong H2 cash generation to achieve the $1.8-$1.9 billion full-year target.
Capital Allocation
Dividend: Quarterly dividend increased 2% to $0.65/share, representing ~$1.1 billion in annual dividends .
Long-Term Shareholder Value Model :
Key Risks and Concerns
-
Volume Weakness: Comparable volumes down ~2.5% reflects challenging market environment; recovery timing uncertain
-
Integration Execution: $650 million 3-year synergy target requires continued flawless execution; inventory discrepancies at 3 Asian facilities led to $15 million charge
-
Leverage: At 3.6x, leverage remains elevated pending cash flow normalization in H2
-
Tariff Exposure: Changes in trade policy and tariff regulations cited as risk factor
-
FX Headwinds: Currency impacts reduced constant currency growth by 3-4% in Q2
Q&A Highlights
Volume Outlook: Management expects H2 volumes to mirror H1 trends. CEO Peter Konieczny noted: "We do see some opportunity for improvement in the back half, but we're hoping for the best and planning for something that's very much consistent with the first half." The bottom half of guidance assumes volumes down ~1.5% (similar to Q2), while upside scenarios incorporate customer pivots toward volume/velocity .
Focus Category Performance :
- Pet Care: High single-digit growth; management believes they are gaining share
- Meat Proteins: Low single-digit growth
- Healthcare: Slightly weaker due to mild U.S. flu season; expected to normalize
- Food Service: Down low single digits on value-conscious consumer behavior
- Focus categories collectively outperformed core portfolio by 50-100 bps
GLP-1 Opportunity: Amcor won a major global pharmaceutical customer launching a solid oral dose GLP-1 therapy drug—supplying blister packaging in Europe and rigid containers in the U.S. CEO Konieczny emphasized the company is "well positioned" to participate in both health trends and innovation supporting customers through dietary shifts .
Non-Core Business Improvement: CFO Steve Scherger detailed that non-core businesses (the $2.5B portfolio including North American beverage) operated at ~3% EBIT margins in Q2 and ~5% for H1, well below normalized 7-8% levels . Key drivers of H2 improvement include:
- Renegotiated customer contracts with better pricing and volume commitments
- Inflation recovery clauses added to contracts
- Improved operational performance
- Expected ~$50M EBIT improvement H2 vs H1
Procurement Synergies: About half of the $650M total synergy target is procurement-related. With $13B in procurement spend ($10B raw materials, $3B indirects) and $5B in resin-based purchases, scale advantages are materializing. CEO Konieczny: "Big buyers that can offer volumes do and can make a difference, and we're seeing that."
New CFO Perspective: Steve Scherger (joined November 2025) praised Amcor's global platform: "This is an incredibly capable global consumer packaging company... The synergy capture momentum here is quite exceptional." On substrate positioning, he noted rigid and flexible packaging has "a right to win and a fit for purpose that is very broad and very much aligned with the day-to-day life of the consumer."
Forward Catalysts
- Q3 FY2026 Earnings (May 2026): $70-80M synergy expectation sets clear bar
- Portfolio Optimization: Closing of ~$100M non-core asset sales
- Growth Synergies: $100M+ annualized sales secured; gaining traction in H2
- Leverage Improvement: Path to 3.1-3.2x by fiscal year-end
- 1 for 5 Reverse Stock Split: Effected January 14, 2026 to enhance investor profile
Bottom Line
Amcor delivered a solid Q2 that validates the Berry acquisition thesis. While volumes remain soft and revenue missed modestly, the EPS beat and accelerating synergy capture ($55M at high-end of expectations) demonstrate execution is on track. With guidance reaffirmed and the stock up nearly 3%, the market is gaining confidence in management's ability to deliver the $650 million synergy target and transition to a ~$3 billion annual cash flow generator.
Data sourced from Amcor Q2 FY2026 Earnings Presentation (February 3, 2026) and S&P Global.